1
Derivatives Rollover Report | October 01, 2021
For Private Circulation Only
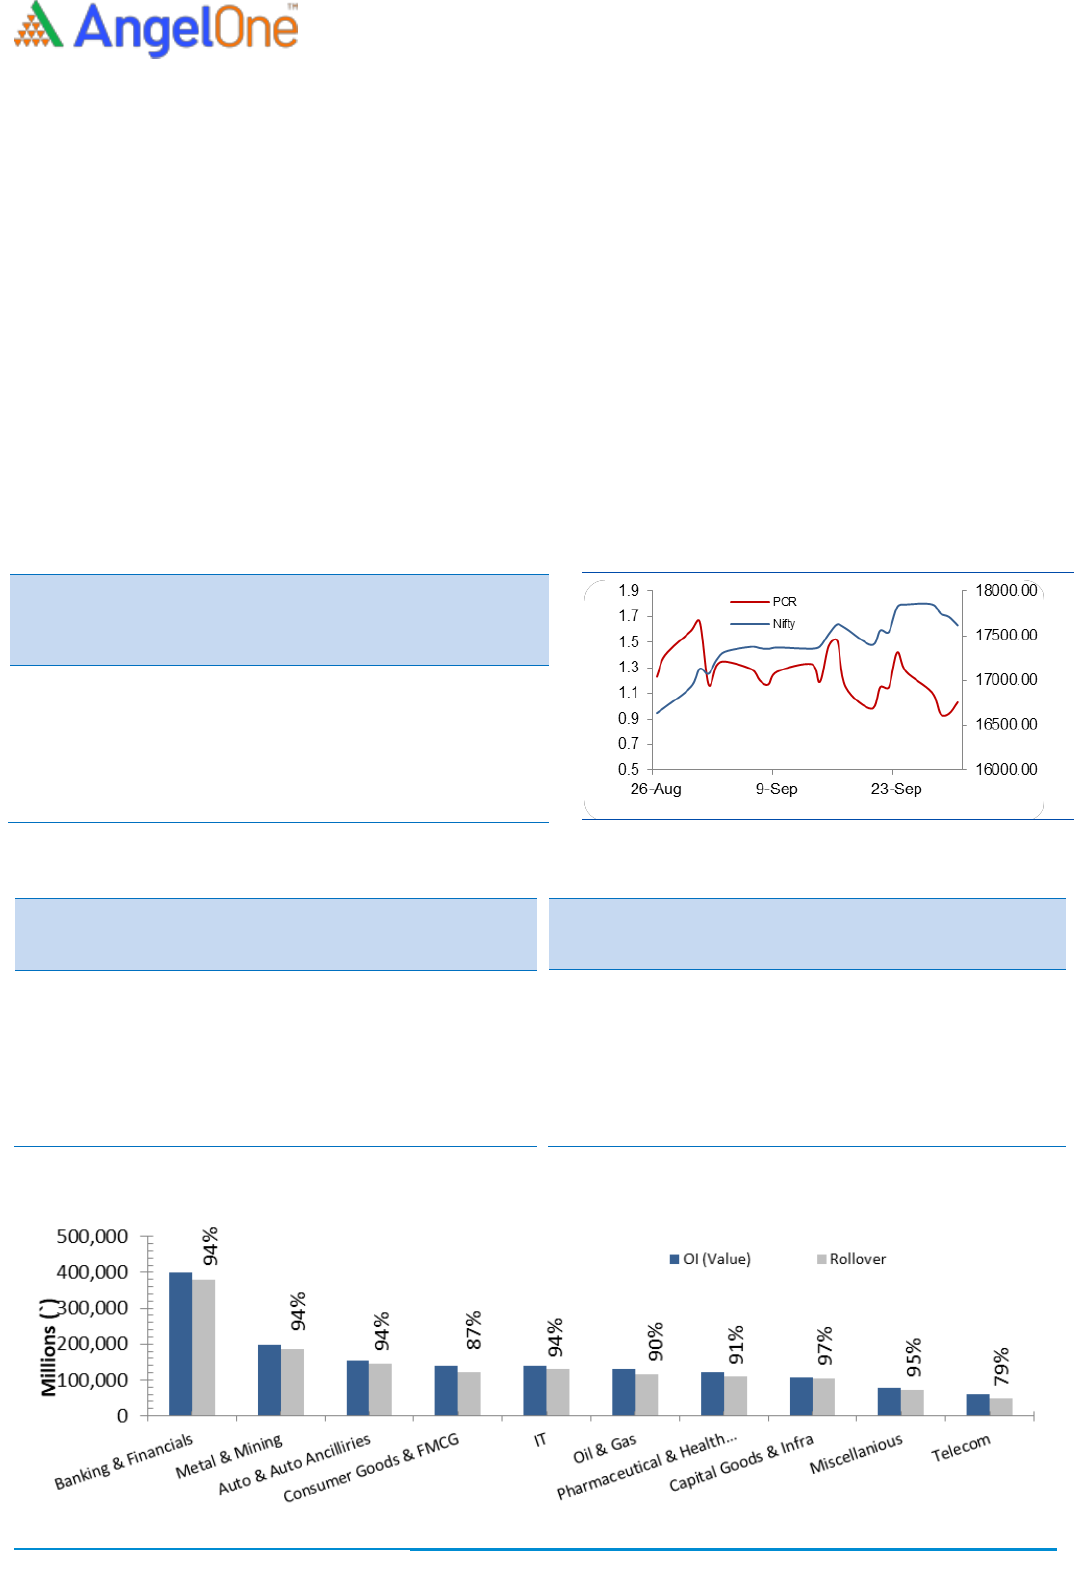
NIFTY & PCR Graph
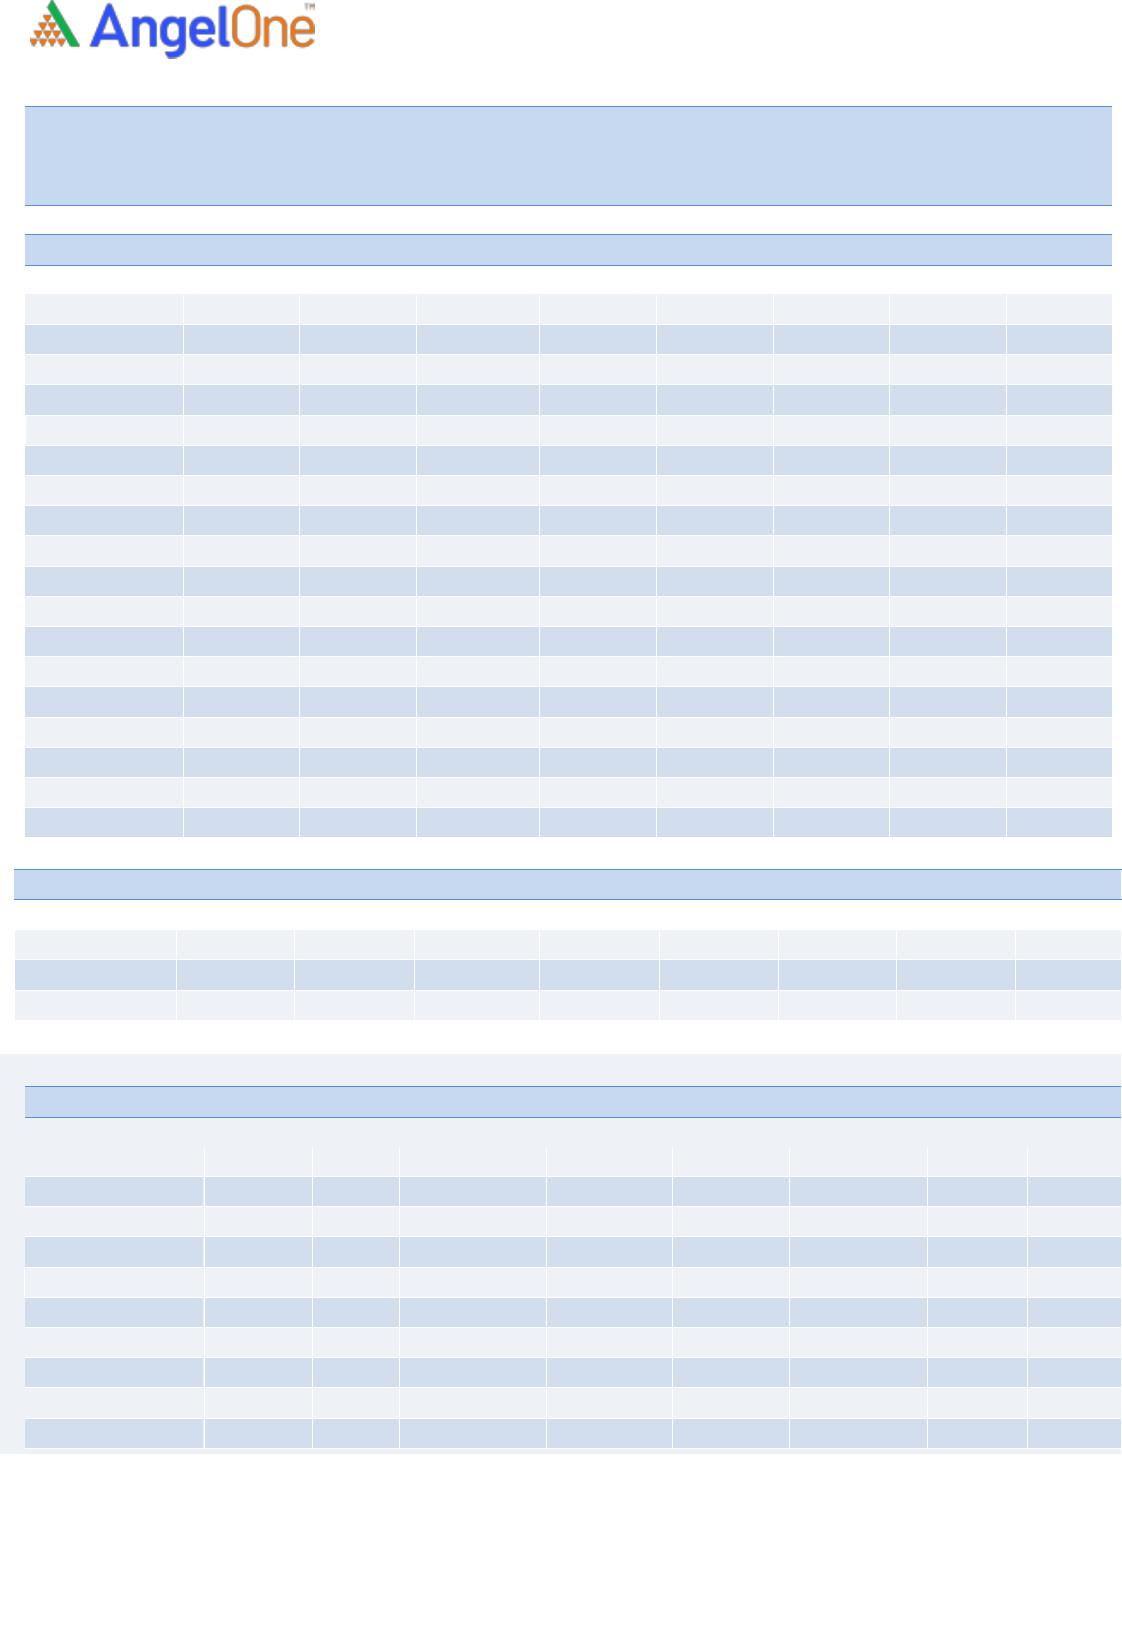
Monthly Gainers
Scrip
Price
Price
Change
(%)
Open
Interest
Ol
Change
(%)
IDEA
12.00
100.00
815570000
171.71
ZEEL
304.25
82.90
47067000
(33.14)
GODREJPROP
2306.50
57.00
2357550
26.29
IRCTC
3814.15
44.89
1904825
5.49
INDUSTOWER
307.05
42.48
12154800
1.31
Note: Stocks which have more than 1000 contract in Futures OI.
Monthly Losers
Scrip
Price
Price
Change
(%)
Open
Interest
Ol
Change
(%)
AUBANK
1168.80
(13.86)
4806000
125.63
GUJGASLTD
640.85
(9.73)
6573750
267.51
BPCL
433.15
(7.51)
37087200
(8.82)
TATASTEEL
1293.00
(6.13)
47719850
14.44
APOLLOHOSP
4490.60
(4.98)
2606500
23.78
Note: Stocks which have more than 1000 contract in Futures OI.
September series turned out to be the historical one as we finally saw the index breaching the much awaited milestone of
17000. This was just a beginning as the real rally was about to unfold. The Nifty first went on to reach the 17500 mark and
then marched towards the magical figure of 18000 which it eventually missed by a small margin. Despite some hiccups in
the latter half of the series, we managed to conclude the September series with remarkable gains of nearly 6%.
Now let’s take a quick glance at the F&O activities. We did see majority of long formation in Nifty as well as BankNifty
during the series. In case of banking index, good amount of these positions have been rolled-over to October series but for
Nifty most of the positions are out of the system. The Rollovers for Nifty stood at 75% which is below the three month
average of 81%. For BankNifty, the rollovers stood at 83% which is above the three month average of 81%. Stronger hands
preferred lightening up their longs and carrying bearish bets in October series, this certainly doesn’t bode well for Bulls.
Now as a result, their index futures ‘Long Short Ratio’ plunged from 65% to 57%. However, they were net buyers in equities
to the tune of Rs. 914 crores in September month. The development seen in derivatives segment hints limited upside going
forward and hence we would advocate traders exiting longs and continue with stock specific trades for a time being.
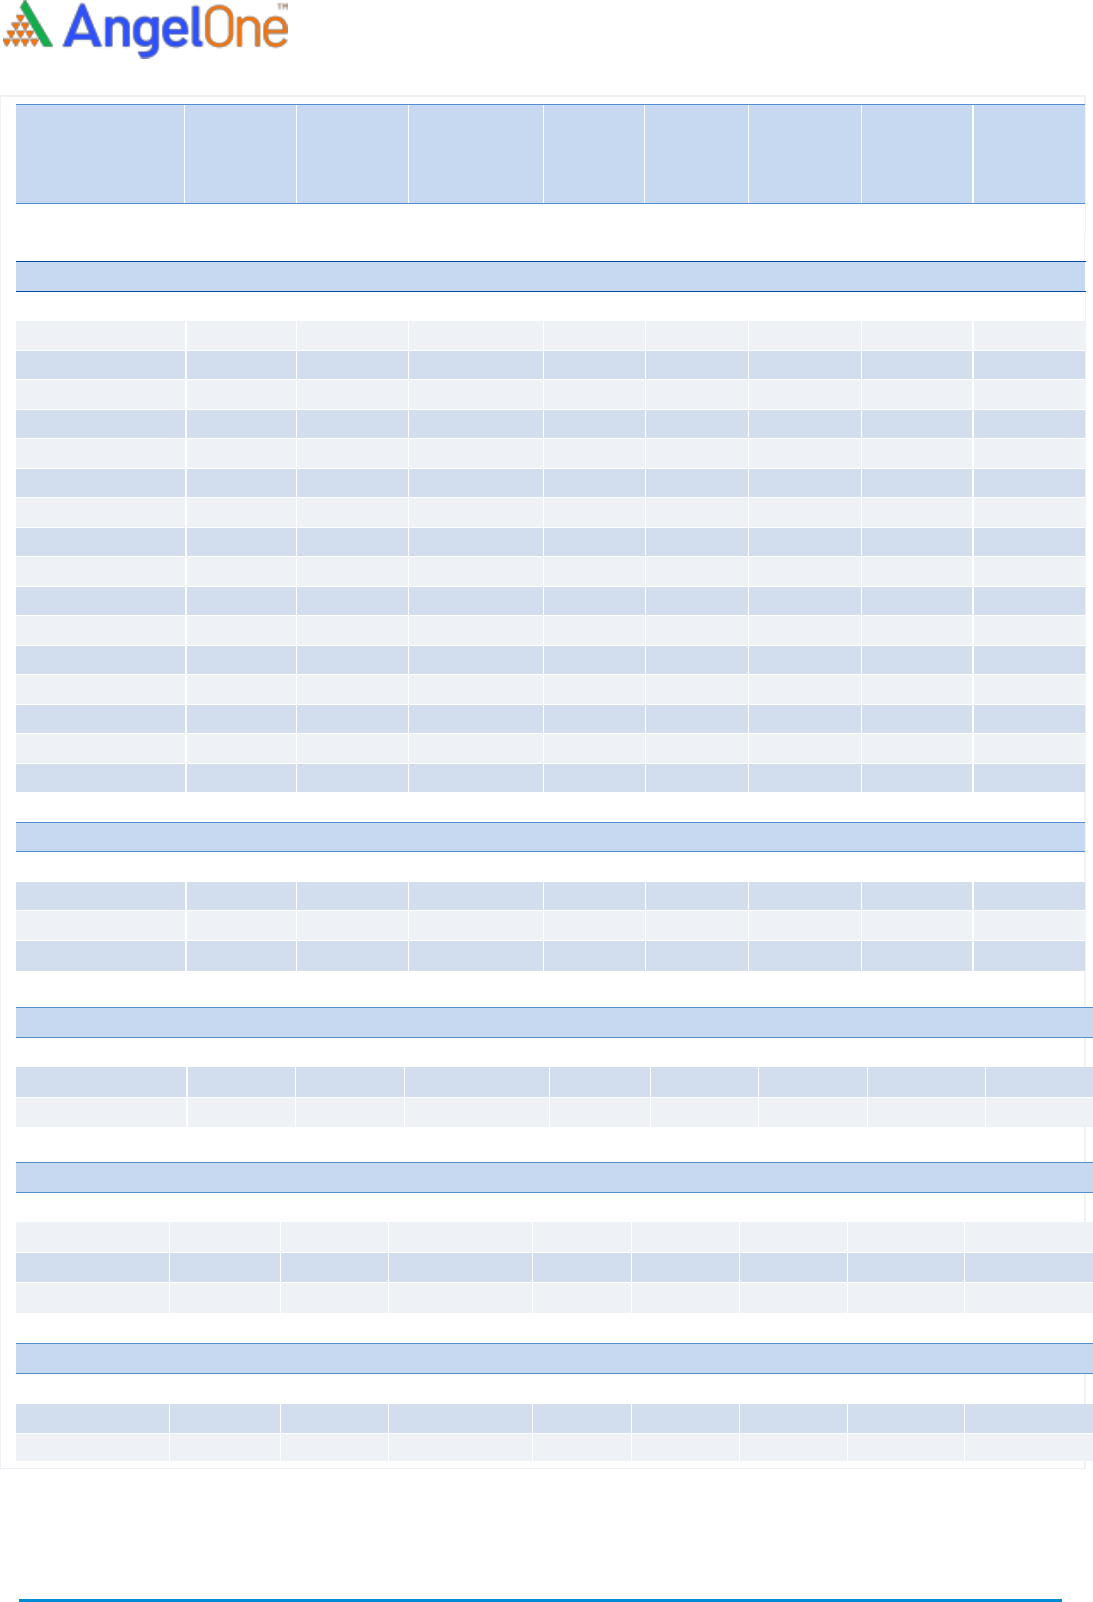
Indices Change
INDEX
Price
Price
Change
(%)
Rollover
3 month
avg.
NIFTY
17618.15
5.86
74.98
80.57
BANKNIFTY
37425.10
5.26
83.49
81.28
FINNIFTY
18303.80
5.36
80.25
77.38
-
-
-
-
-
-
-
-
-
-
Derivatives Rollover Report
For Private Circulation Only
2
Scrip
Price
Price
Change
(%)
OI Futures
OI
Change
(%)
COC (%)
PCR-OI
Rollover
(%)
Average
Rollover
(3month)
(%)
AUTO & AUTO ANCILLARIES
AMARAJABAT
753.90
12.84
8589000
(3.24)
7.04
0.48
97.23
95.18
APOLLOTYRE
226.80
8.52
13255000
(2.29)
6.35
0.46
97.25
96.13
ASHOKLEY
134.55
14.61
54441000
52.93
7.31
0.48
95.50
94.73
BAJAJ-AUTO
3841.85
3.87
3003000
49.83
3.13
0.52
97.30
95.81
BALKRISIND
2545.10
11.78
1598000
32.90
5.89
1.60
85.07
90.97
BHARATFORG
740.55
1.64
10501500
21.59
5.48
0.41
96.82
95.51
BOSCHLTD
15553.75
13.75
149400
(6.36)
6.68
0.55
96.32
96.64
EICHERMOT
2791.00
9.73
3668000
(10.88)
0.35
0.54
90.68
94.65
ESCORTS
1488.25
10.28
6717150
15.11
7.18
0.47
95.24
95.53
EXIDEIND
179.25
13.70
32472000
33.02
7.31
0.49
95.09
93.83
HEROMOTOCO
2846.90
7.25
4145400
(19.34)
6.63
0.68
96.95
95.83
M&M
804.90
2.81
12614700
17.01
3.00
0.41
84.34
91.80
MARUTI
7354.40
10.81
3113400
(6.07)
2.91
0.50
92.95
94.63
MOTHERSUMI
227.20
7.07
31055500
1.94
7.21
0.63
97.33
94.35
MRF
79529.40
3.58
48730
7.45
2.53
0.47
97.13
98.10
TATAMOTORS
334.15
17.29
98299350
(7.10)
3.13
0.46
94.99
92.44
TVSMOTOR
552.30
8.21
5441800
0.88
6.76
0.47
95.64
93.15
BANKING & FINANCIALS
AUBANK
1168.80
(13.86)
4806000
125.63
5.09
0.55
96.76
94.38
AXISBANK
770.35
3.00
35071200
33.40
6.46
0.53
92.96
95.88
BAJAJFINSV
17841.80
11.42
724425
(9.01)
4.03
0.43
80.78
84.03
BAJFINANCE
7687.25
10.45
4219250
4.76
3.24
0.57
94.32
94.46
BANDHANBNK
284.45
7.10
26168400
(10.21)
6.68
0.53
97.45
93.98
BANKBARODA
81.95
10.22
159962400
(2.51)
3.19
0.58
96.44
95.75
CANBK
173.90
13.25
79374600
29.45
6.78
0.49
96.74
89.78
CHOLAFIN
566.95
6.33
11242500
10.59
6.24
0.30
98.11
96.40
CUB
158.55
9.31
8348300
15.28
7.44
0.31
98.07
96.51
FEDERALBNK
84.80
8.23
88990000
9.90
7.73
0.45
96.65
96.24
HDFC
2761.75
1.98
12759300
4.77
3.53
0.55
98.40
94.39
HDFCAMC
2924.90
(2.11)
3237400
272.11
7.31
0.68
96.34
96.23
HDFCBANK
1600.15
2.77
32770650
51.31
4.25
0.52
96.73
92.39
IBULHSGFIN
232.65
5.75
37156600
7.84
5.63
0.45
98.20
93.35
ICICIBANK
704.20
0.54
80009875
(5.32)
6.23
0.60
98.54
94.71
ICICIPRULI
674.20
2.94
4242000
(28.21)
4.56
0.48
72.53
85.63
IDFCFIRSTB
47.90
13.11
172083000
(6.01)
6.84
0.47
96.39
95.14
INDUSINDBK
1117.70
11.41
14493600
18.59
6.80
0.34
91.15
94.90
KOTAKBANK
2011.55
17.94
10920800
(32.65)
3.93
0.50
83.35
92.17
Derivatives Rollover Report
For Private Circulation Only
3
Scrip
Price
Price
Change
(%)
OI Futures
OI
Change
(%)
COC (%)
PCR-OI
Rollover
(%)
Average
Rollover
(3month)
(%)
L&TFH
91.45
12.21
62307368
8.84
7.17
0.44
95.88
94.43
LICHSGFIN
429.25
13.01
18460000
(22.72)
6.72
0.62
94.50
93.46
M&MFIN
185.70
19.61
24924000
(20.69)
3.52
0.45
92.22
93.38
MANAPPURAM
169.95
4.97
20850000
(10.00)
6.17
0.70
95.99
90.07
MFSL
1016.85
(1.04)
2562950
(16.02)
3.41
0.67
95.96
96.51
MUTHOOTFIN
1457.55
(2.20)
3541500
18.58
6.56
0.91
97.32
96.20
NAM-INDIA
428.05
4.62
2259200
(36.99)
8.27
0.49
88.08
92.72
PFC
143.05
16.30
26015200
(1.73)
8.71
0.44
91.00
92.43
PNB
40.25
11.96
305056000
7.42
4.88
0.55
97.87
96.13
RBLBANK
191.25
17.26
23803200
(29.05)
2.39
0.55
93.02
92.41
RECLTD
158.70
10.90
22842000
11.35
7.02
0.50
95.89
89.68
SBIN
454.10
10.31
83392500
(6.93)
3.17
0.52
93.38
93.85
SRTRANSFIN
1307.70
2.94
4675600
(1.84)
8.88
0.42
94.00
96.45
CAPITAL GOODS & INFRASTRUCTURE
ADANIPORTS
739.95
2.06
89512500
3.21
3.62
0.62
98.68
98.64
BHEL
64.90
24.45
115878000
4.32
5.04
0.53
96.02
96.11
GMRINFRA
38.55
33.85
109800000
8.71
6.80
0.45
91.94
91.97
HAVELLS
1380.90
13.42
4654500
16.48
7.41
0.38
86.51
92.11
LT
1707.50
6.83
11298175
(9.71)
3.48
0.52
94.90
96.50
SIEMENS
2134.20
(3.66)
1882100
3.87
2.97
0.37
95.48
95.50
VOLTAS
1225.30
27.67
2894000
(17.75)
7.76
0.39
89.75
92.20
CEMENT
ACC
2262.40
(0.78)
2904500
4.74
4.57
0.60
96.08
91.38
AMBUJACEM
402.35
1.11
17637000
24.42
7.00
0.39
90.63
80.24
GRASIM
1676.60
16.07
10185900
(0.81)
5.62
0.29
96.27
90.40
RAMCOCEM
985.60
1.78
2084200
15.28
1.19
0.45
97.57
97.18
SHREECEM
28995.60
9.06
143675
(30.20)
4.21
0.38
92.74
91.62
ULTRACEMCO
6728.40
4.54
1574200
5.44
9.68
0.43
96.14
96.10
PIDILITIND
541.95
(5.51)
851000
35.73
8.05
0.33
74.71
71.65
TATACHEM
434.45
4.36
4853200
9.42
8.35
0.78
91.19
91.58
UPL
433.55
(9.37)
8288000
39.98
7.63
0.66
88.39
86.74
ASIANPAINT
738.55
3.97
5346500
1.00
14.06
0.46
84.48
81.93
COLPAL
1773.00
(6.01)
898875
4.81
12.04
0.18
86.06
85.08
DABUR
231.25
(5.80)
1755000
(51.71)
12.65
0.37
66.43
77.82
CHEMICALS & FERTILIZERS
AARTIIND
932.05
2.93
2826250
26.38
3.08
0.53
92.39
91.34
COROMANDEL
798.50
3.74
2171875
61.33
6.65
0.57
97.42
#N/A
DEEPAKNTR
2410.05
15.12
2499500
(9.24)
1.92
0.54
95.80
95.78
NAVINFLUOR
3695.90
2.57
632475
54.79
3.96
0.82
92.62
93.70
PIDILITIND
2387.05
6.93
2493500
(3.73)
2.79
0.54
92.47
94.82
PIIND
3186.25
1.20
1321500
42.29
3.22
0.49
89.87
94.52
TATACHEM
924.15
11.59
11465000
13.36
6.88
0.48
95.58
95.16
UPL
710.80
(1.59)
24659700
1.68
5.71
0.70
97.51
97.40
OIL & GAS
Derivatives Rollover Report
For Private Circulation Only
4
Scrip
Price
Price
Change
(%)
OI Futures
OI
Change
(%)
COC (%)
PCR-OI
Rollover
(%)
Average
Rollover
(3month)
(%)
Consumer Goods & FMCG
ASIANPAINT
3254.40
6.88
3729000
(22.88)
3.92
0.42
90.82
93.88
BERGEPAINT
810.75
2.86
4734400
1.82
2.82
0.46
97.33
96.31
BERGEPAINT
BRITANNIA
3969.10
0.87
1060200
(19.73)
6.65
0.27
91.10
82.96
BRITANNIA
COLPAL
1671.70
0.73
2374750
(4.17)
1.72
0.47
76.12
88.99
COLPAL
DABUR
620.35
2.24
10012500
(10.12)
6.97
0.55
93.37
95.82
DABUR
GODREJCP
1034.40
(1.16)
4836000
(0.04)
5.70
0.47
84.25
90.87
GODREJCP
HINDUNILVR
2695.45
0.95
5210700
(26.68)
-3.06
0.51
91.16
94.65
HINDUNILVR
ITC
236.85
15.31
174720000
(0.70)
3.86
0.59
84.08
91.63
ITC
JUBLFOOD
4066.05
6.00
1604750
(1.19)
8.11
0.57
90.41
83.88
JUBLFOOD
MARICO
550.05
4.79
8502000
(17.50)
6.07
0.70
83.78
91.62
MARICO
MCDOWELL-N
856.65
24.52
16870000
17.16
5.42
0.31
92.24
95.62
MCDOWELL-N
NESTLEIND
19445.00
(3.16)
239800
(37.42)
-0.04
0.86
64.46
86.51
NESTLEIND
TATACONSUM
818.00
(4.36)
10917450
45.14
7.05
0.61
94.23
94.67
TATACONS
UM
TITAN
2166.95
18.85
4510500
(2.29)
3.11
0.29
90.74
94.62
TITAN
UBL
1580.65
9.80
1558200
8.32
7.59
0.39
93.02
94.16
UBL
COALINDIA
293.80
1.71
14714400
2
9
.
8
0
8.26
0.35
63.04
65.79
HINDALCO
88.10
30.23
34330000
(
1
3
.
3
6
)
2.22
0.61
78.46
82.59
HINDZINC
182.40
10.61
3964800
1
0
8
.
5
9
-8.52
0.34
71.17
74.01
JINDALSTEL
60.45
11.12
32228000
(
9
.
0
1
)
4.33
0.32
80.34
78.99
JSWSTEEL
1284.95
14.48
6561000
(
1
9
.
0
2
)
1.73
0.48
88.22
83.14
(
METALS & MINING
COALINDIA
186.15
38.45
62344800
9.73
7.39
0.53
85.82
88.74
HINDALCO
488.60
15.07
25019550
(30.27)
1.74
0.51
67.35
77.04
JINDALSTEL
390.20
5.02
40495000
14.14
3.18
0.84
97.54
96.77
JSWSTEEL
671.95
(0.21)
45721800
(1.46)
7.12
0.65
99.06
98.23
NATIONALUM
93.95
18.92
88638000
28.84
7.68
0.44
95.70
87.80
NMDC
143.70
(4.30)
109035800
75.40
6.38
0.57
95.62
81.74
SAIL
114.25
(0.65)
160170000
18.38
6.88
0.62
97.09
91.13
TATASTEEL
1293.00
(6.13)
47719850
14.44
4.15
0.71
97.24
95.45
VEDL
288.40
(0.19)
113708000
(10.39)
3.40
0.62
93.84
95.59
TEXTILES
ARVIND
66.40
(15.36)
5862000
(11.53)
5.92
1.09
82.52
89.16
INFORMATION TECHNOLOGY
COFORGE
5244.55
5.39
791000
12.23
0.81
0.15
96.49
89.53
HCLTECH
1275.55
9.11
15889300
(4.00)
-4.08
0.54
83.56
88.31
INFY
1666.55
(3.78)
34065600
22.59
-6.73
0.64
95.06
91.80
LTI
5775.75
11.92
576000
(13.47)
2.36
0.42
77.61
88.53
MINDTREE
4219.65
20.22
2595200
51.48
6.07
0.22
93.22
90.51
MPHASIS
3122.50
15.49
2114450
90.23
7.60
0.26
97.97
84.63
NAUKRI
6453.95
10.95
840750
(9.49)
4.57
0.53
86.02
86.11
TCS
3773.45
2.56
7570200
(14.79)
-0.73
0.56
89.79
91.10
TECHM
1387.80
(4.69)
12711600
37.13
6.80
0.49
97.19
92.84
WIPRO
637.65
1.16
32505600
19.33
7.30
0.56
95.74
95.40
TELECOM
BHARTIARTL
350.55
0.39
34602594
(4.18)
7.10
0.90
89.38
87.82
IDEA
12.45
(7.43)
363300000
(10.52)
10.56
0.83
82.76
85.28
INFRATEL
276.95
1.58
6836000
3.14
10.20
0.49
84.58
83.89
TEXTILES
ARVIND
66.40
(15.36)
5862000
(11.53)
5.92
1.09
82.52
89.16
CENTURYTEX
959.75
(7.62)
3744000
5.98
-1.70
0.81
98.89
99.06
PAGEIND
20491.75
6.10
156325
9.82
-9.51
0
96.19
89.39
RAYMOND
739.95
(13.35)
2732800
4.75
7.00
1.38
97.21
96.63
SRF
3044.00
4.24
923500
9.81
8.82
0.56
95.08
96.97
MEDIA
Derivatives Rollover Report
For Private Circulation Only
5
Scrip
Price
Price
Change
(%)
OI Futures
OI
Change
(%)
COC (%)
PCR-OI
Rollover
(%)
Average
Rollover
(3month)
(%)
INFORMATION TECHNOLOGY
HCLTECH
564.00
(0.70)
22885800
(1.26)
8.14
0.58
98.56
96.78
INFY
730.55
3.77
24351600
(52.50)
2.86
0.74
55.98
79.52
MINDTREE
782.95
10.93
1041600
(14.29)
-15.63
0.59
93.13
93.37
NIITTECH
1606.65
6.68
578250
26.08
-2.03
0.46
89.76
82.99
TCS
2212.80
6.19
15671500
(17.22)
6.42
1.91
95.02
94.74
TECHM
775.75
1.00
15406800
8.21
9.05
0.65
96.29
97.15
WIPRO
249.90
3.65
18211200
(29.64)
-2.08
0.72
83.12
92.60
MISCELLANIOUS
ABFRL
247.30
22.91
9544600
4.80
5.03
0.35
72.74
#N/A
ADANIENT
1474.95
(0.44)
26550000
62.13
6.13
0.72
97.57
97.80
APOLLOHOSP
4490.60
(4.98)
2606500
23.78
2.60
0.50
92.37
82.72
ASTRAL
2169.95
9.75
474925
35.45
5.76
0.37
95.68
#N/A
BATAINDIA
1783.60
4.00
1747900
(0.47)
4.07
0.22
92.06
93.40
BEL
203.10
12.33
25555000
9.14
0.96
0.45
94.56
90.02
CONCOR
708.10
8.06
7099146
(0.79)
7.03
0.55
91.61
90.90
CUMMINSIND
997.85
1.27
1728000
(26.85)
7.75
0.81
76.51
81.41
HDFCLIFE
726.15
3.72
17942100
(15.20)
6.77
0.69
94.80
91.95
ICICIGI
1595.10
8.03
2215525
13.33
4.63
0.64
97.35
96.72
INDHOTEL
182.50
32.20
16493100
120.61
7.90
0.41
85.06
#N/A
INDIGO
2024.75
15.69
3977000
65.98
1.97
0.36
93.26
95.29
IRCTC
3814.15
44.89
1904825
5.49
5.39
0.39
84.23
89.18
LALPATHLAB
3667.50
(3.40)
587250
60.23
-3.31
0.71
95.18
91.24
LTTS
4714.90
21.90
477000
(9.45)
4.83
0.25
84.31
82.86
METROPOLIS
2701.20
0.49
462400
47.36
0.22
0.71
95.66
#N/A
SBILIFE
1218.55
5.57
7702500
27.64
3.70
0.32
78.61
70.61
TRENT
1029.70
8.80
1386200
2.80
4.89
0.19
89.98
94.21
MEDIA
PVR
1605.35
22.96
2652826
58.74
4.93
0.36
93.37
94.79
SUNTV
509.90
6.92
10978500
(15.80)
11.74
0.49
79.28
86.03
ZEEL
304.25
82.90
47067000
(33.14)
4.51
0.69
88.77
92.47
IGL
506.15
(1.77)
5178250
(23.81)
7.68
1.13
97.21
91.91
IOC
91.70
(9.79)
62803000
(12.25)
9.18
0.66
93.34
91.89
MGL
1142.20
(4.95)
1020000
(34.79)
1.01
0.96
95.18
90.39
ONGC
102.90
(13.13)
38269000
(13.29)
9.20
0.69
92.19
84.88
PETRONET
222.20
(14.51)
18006000
4.88
6.85
0.92
96.78
95.76
RELIANCE
2008.90
(6.90)
26297500
(1.73)
9.11
0.63
97.62
95.78
BPCL
470.70
11.69
44681400
8.98
8.89
0.51
93.84
91.32
BATAINDIA
1444.10
8.68
1488850
(10.54)
-2.88
0.42
93.06
94.61
BEL
115.85
1.49
22602000
(2.49)
10.21
0.44
97.34
96.42
MCX
659.60
(6.88)
2102100
(7.23)
11.16
0.79
93.26
90.88
MCX
1111.60
2.65
1348000
12.33
-3.27
0.66
92.87
80.54
OIL & GAS
BPCL
433.15
(7.51)
37087200
(8.82)
2.87
0.40
91.04
93.52
GAIL
159.85
11.59
48348600
47.65
8.21
0.42
96.25
95.63
GUJGASLTD
640.85
(9.73)
6573750
267.51
6.95
0.57
96.50
92.07
HINDPETRO
300.50
17.34
19761300
(7.51)
2.17
0.29
94.38
95.10
IGL
535.35
2.46
11932250
30.87
5.50
0.58
96.68
87.78
IOC
125.75
18.91
37862500
(23.92)
4.68
0.55
85.71
92.31
MGL
1088.75
(1.70)
3182400
91.20
7.34
0.69
97.54
97.35
ONGC
144.85
26.62
56494900
23.15
3.16
0.37
69.39
81.85
PETRONET
239.55
5.07
23700000
19.39
5.46
0.47
95.43
96.10
RELIANCE
2520.55
12.80
27915750
(12.93)
0.67
0.57
90.56
93.37
AUROPHARMA
1037.15
6.60
8765250
(5.00)
7.85
0.51
97.81
95.86
BIOCON
383.45
(3.23)
17434000
0.03
5.93
0.71
86.18
89.52
CADILAHC
629.55
11.44
22301400
43.30
6.29
0.51
95.72
93.45
CIPLA
946.80
3.82
10505950
(19.23)
6.89
0.53
91.10
89.74
OIL & GAS
Derivatives Rollover Report
For Private Circulation Only
6
Scrip
Price
Price
Change
(%)
OI Futures
OI
Change
(%)
COC
(%)
PCR-OI
Rollover
(%)
Average
Rollover
(3month)
(%)
PHARMACEUTICAL
ALKEM
4001.40
3.44
392200
(0.61)
6.76
0.27
95.75
88.57
APLLTD
790.85
7.18
2365000
32.27
2.89
0.38
97.86
93.85
AUROPHARMA
728.15
3.73
14463800
(15.66)
5.93
0.53
96.40
95.72
BIOCON
364.00
6.57
16516300
(2.85)
4.67
0.55
97.22
95.00
CADILAHC
554.35
2.35
18143400
(7.83)
5.91
0.66
97.13
94.93
CIPLA
985.90
8.11
7853950
(35.63)
2.98
0.36
75.23
88.94
DIVISLAB
4812.75
(1.11)
2390000
19.11
3.82
0.61
95.03
91.71
DRREDDY
4901.65
8.40
2669125
(16.73)
5.54
0.61
96.95
96.38
GLENMARK
512.90
0.05
7355400
(11.03)
6.26
0.46
97.47
94.13
GRANULES
320.95
(2.01)
11277800
0.75
2.44
0.42
96.41
86.29
LUPIN
955.25
1.68
11624600
11.02
5.00
0.65
95.83
95.10
PEL
2609.65
1.35
4415125
57.32
7.01
0.58
97.43
97.51
PFIZER
5609.65
(1.74)
231375
6.14
6.68
0.65
95.22
94.47
STAR
592.65
1.41
2436750
24.48
6.97
0.54
97.10
#N/A
SUNPHARMA
822.35
7.73
33454400
(2.66)
6.53
0.56
82.75
89.33
TORNTPHARM
3092.15
1.21
727500
0.83
2.89
0.26
94.70
96.42
POWER
NTPC
141.70
28.82
49840800
(16.07)
-1.38
0.35
78.93
85.30
POWERGRID
190.25
11.00
35229798
45.12
2.40
0.36
89.01
81.80
TATAPOWER
159.65
26.86
138253500
12.77
7.39
0.77
95.40
95.38
REAL ESTATE
DLF
419.30
35.63
31531500
(30.41)
6.56
0.61
92.34
91.48
GODREJPROP
2306.50
57.00
2357550
26.29
-3.04
0.41
89.93
92.92
TELECOM
BHARTIARTL
691.50
17.32
72754336
(19.65)
6.06
0.50
78.23
88.04
IDEA
12.00
100.00
815570000
171.71
10.95
0.49
88.51
78.67
INDUSTOWER
307.05
42.48
12154800
1.31
-6.97
0.40
86.01
87.47
TEXTILES
PAGEIND
31905.90
4.24
81570
1.23
8.28
0.48
95.87
97.38
SRF
11325.95
24.22
672250
9.02
5.40
0.47
87.59
90.77
NTPC
140.85
3.57
63643200
46.15
6.51
0.42
74.18
71.71
POWERGRID
208.95
8.77
31196000
46.96
7.85
0.98
86.83
81.73
TATAPOWER
69.25
(0.22)
53307000
(2.47)
11.39
0.95
92.66
92.57
TORNTPOWER
280.50
13.36
4017000
90.20
-26.19
1.31
84.48
88.46

Derivatives Rollover Report
For Private Circulation Only
7
Technical and Derivatives Team:
Sameet Chavan Chief Analyst - Technical & Derivatives sameet.chavan@angelbroking.com
Ruchit Jain Senior Analyst - Technical & Derivatives ruchit.jain@angelbroking.com
Rajesh Bhosale Technical Analyst rajesh.bhosle@angelbroking.com
Research Team Tel: 022 - 39357600 (EXTN - 6844) Website: www.angelbroking.com
For Technical & Derivative Queries E-mail: technicalresearch-cso@angelbroking.com
DISCLAIMER
Angel Broking Limited (hereinafter referred to as “Angel”) is a registered Member of National Stock Exchange of India
Limited, Bombay Stock Exchange Limited and Metropolitan Stock Exchange Limited. It is also registered as a Depository
Participant with CDSL and Portfolio Manager and Investment Adviser with SEBI. It also has registration with AMFI as a
Mutual Fund Distributor. Angel Broking Limited is a registered entity with SEBI for Research Analyst in terms of SEBI
(Research Analyst) Regulations, 2014 vide registration number INH000000164. Angel or its associates has not been
debarred/ suspended by SEBI or any other regulatory authority for accessing /dealing in securities Market. Angel or its
associates/analyst has not received any compensation / managed or co-managed public offering of securities of the
company covered by Analyst during the past twelve months.
This document is solely for the personal information of the recipient, and must not be singularly used as the basis of any
investment decision. Nothing in this document should be construed as investment or financial advice. Each recipient of
this document should make such investigations as they deem necessary to arrive at an independent evaluation of an
investment in the securities of the companies referred to in this document (including the merits and risks involved), and
should consult their own advisors to determine the merits and risks of such an investment.
Reports based on technical and derivative analysis center on studying charts of a stock's price movement, outstanding
positions and trading volume, as opposed to focusing on a company's fundamentals and, as such, may not match
with a report on a company's fundamentals. Investors are advised to refer the Fundamental and Technical Research
Reports available on our website to evaluate the contrary view, if any.
The information in this document has been printed on the basis of publicly available information, internal data and
other reliable sources believed to be true, but we do not represent that it is accurate or complete and it should not be
relied on as such, as this document is for general guidance only. Angel Broking Limited or any of its affiliates/ group
companies shall not be in any way responsible for any loss or damage that may arise to any person from any
inadvertent error in the information contained in this report. Angel Broking Limited has not independently verified all the
information contained within this document. Accordingly, we cannot testify, nor make any representation or warranty,
express or implied, to the accuracy, contents or data contained within this document. While Angel Broking Limited
endeavors to update on a reasonable basis the information discussed in this material, there may be regulatory,
compliance, or other reasons that prevent us from doing so.
This document is being supplied to you solely for your information, and its contents, information or data may not be
reproduced, redistributed or passed on, directly or indirectly.
Neither Angel Broking Limited, nor its directors, employees or affiliates shall be liable for any loss or damage that may
arise from or in connection with the use of this information.
Derivative Research Team derivatives.desk@angelbroking.com
